Why I wrote this
I worked through Alex Huth’s tutorial that builds a semantic encoding model for fMRI during natural story listening. While going through the code I kept asking very basic yet critical questions. This blog records those questions and what I learned. I use simple language and define terms as soon as they appear.
I would recommend you, first follow this tutorial https://github.com/HuthLab/speechmodeltutorial and then read this blog as almost all questions which I list directly link to this tutorial.
Quick background
MRI vs fMRI: MRI gives detailed pictures of brain anatomy. fMRI measures slow changes in blood oxygen (called BOLD) that follow neural activity over seconds. fMRI lets us track which areas are engaged while someone listens to a story.
I found this book “Introduction to Functional Magnetic Resonance Imaging” might be worth looking into if you are more interested!
Encoding model idea: Give the model a time line of features that describe the story, and let it predict the fMRI signal in each tiny 3‑D location of the brain (a voxel). If the prediction matches the measured signal for a held‑out story, those features likely matter for that location.
My questions and what I learned
1) MRI vs fMRI – what is the practical difference here
MRI is for structure (what the brain looks like). fMRI is for function (how the signal changes over time during a task). The tutorial uses fMRI because we want to model time‑locked responses to speech.
2) What are we actually predicting – are we showing the brain a word and reading it out?
We predict the timecourse of the fMRI signal in each voxel from time‑varying features of the story. We do not point to a single word and light up a single spot. fMRI is slow, so many words blur together. We predict the overall rise and fall of the signal that tracks the meaning content flowing through time.
Time‑varying features (examples):
Acoustic envelope – a number for how loud the sound is at each moment.
Phoneme indicators – tiny 0 or 1 time marks for each speech sound like /p/ or /a/.
Semantic vectors – numbers that represent word meanings aligned to the times words are heard.
3) What is the 3‑lobe Lanczos filter and why do we downsample
Downsampling means keeping fewer time points, for example converting high‑rate features to match the slower fMRI sampling rate (the TR).
If we drop samples without care, aliasing happens. Aliasing is when fast changes that we did not sample fast enough fold into fake slow changes. That can mislead the model.
To avoid this, we first use a low‑pass filter that keeps slow changes and removes fast ones before we drop samples. A low‑pass used for this purpose is called an anti‑aliasing filter.
The 3‑lobe Lanczos filter is a practical anti‑aliasing filter. It gives high‑quality smoothing for resampling. Pipeline: smooth the high‑rate features with Lanczos, then downsample to the TR so features and fMRI are aligned.
4) Why do we concatenate features across stories
We stack the time lines from multiple stories end‑to‑end to get more training samples for the regression. More samples make the learned weights more stable and reduce overfitting. We still keep some story or segments held out for testing.
5) In the “combined stimuli” plot, what are “features 1–10” on the y‑axis
Those are columns of the semantic feature matrix through time. Each column is one semantic dimension. The plot usually shows the first 10 columns as a small example, not the full set.
6) What is the FIR model and what does the FIR feature plot show
fMRI lags behind neural activity by seconds. To capture this, we make time‑shifted copies of every feature (for example at 0, 2, 4, 6 seconds of delay). This is a Finite Impulse Response model.
The regression learns one weight for each feature at each delay for each voxel. The FIR plot shows those learned weights across delays. A peak at 4 to 6 seconds says that voxel responds strongest about that many seconds after the feature occurs.
7) What are zRresp, zPresp and what is a z‑score
A z‑score standardizes a signal by subtracting its mean and dividing by its standard deviation. The result has mean 0 and standard deviation 1.
zRresp is the z‑scored measured fMRI response. zPresp is the z‑scored predicted response from the model. Standardizing both makes correlation a clean shape match, independent of amplitude.
8) What is a voxel and what is the “mosaic” view
A voxel is a 3‑D pixel, a small cube of brain tissue in the image. fMRI gives us one number per voxel per time point.
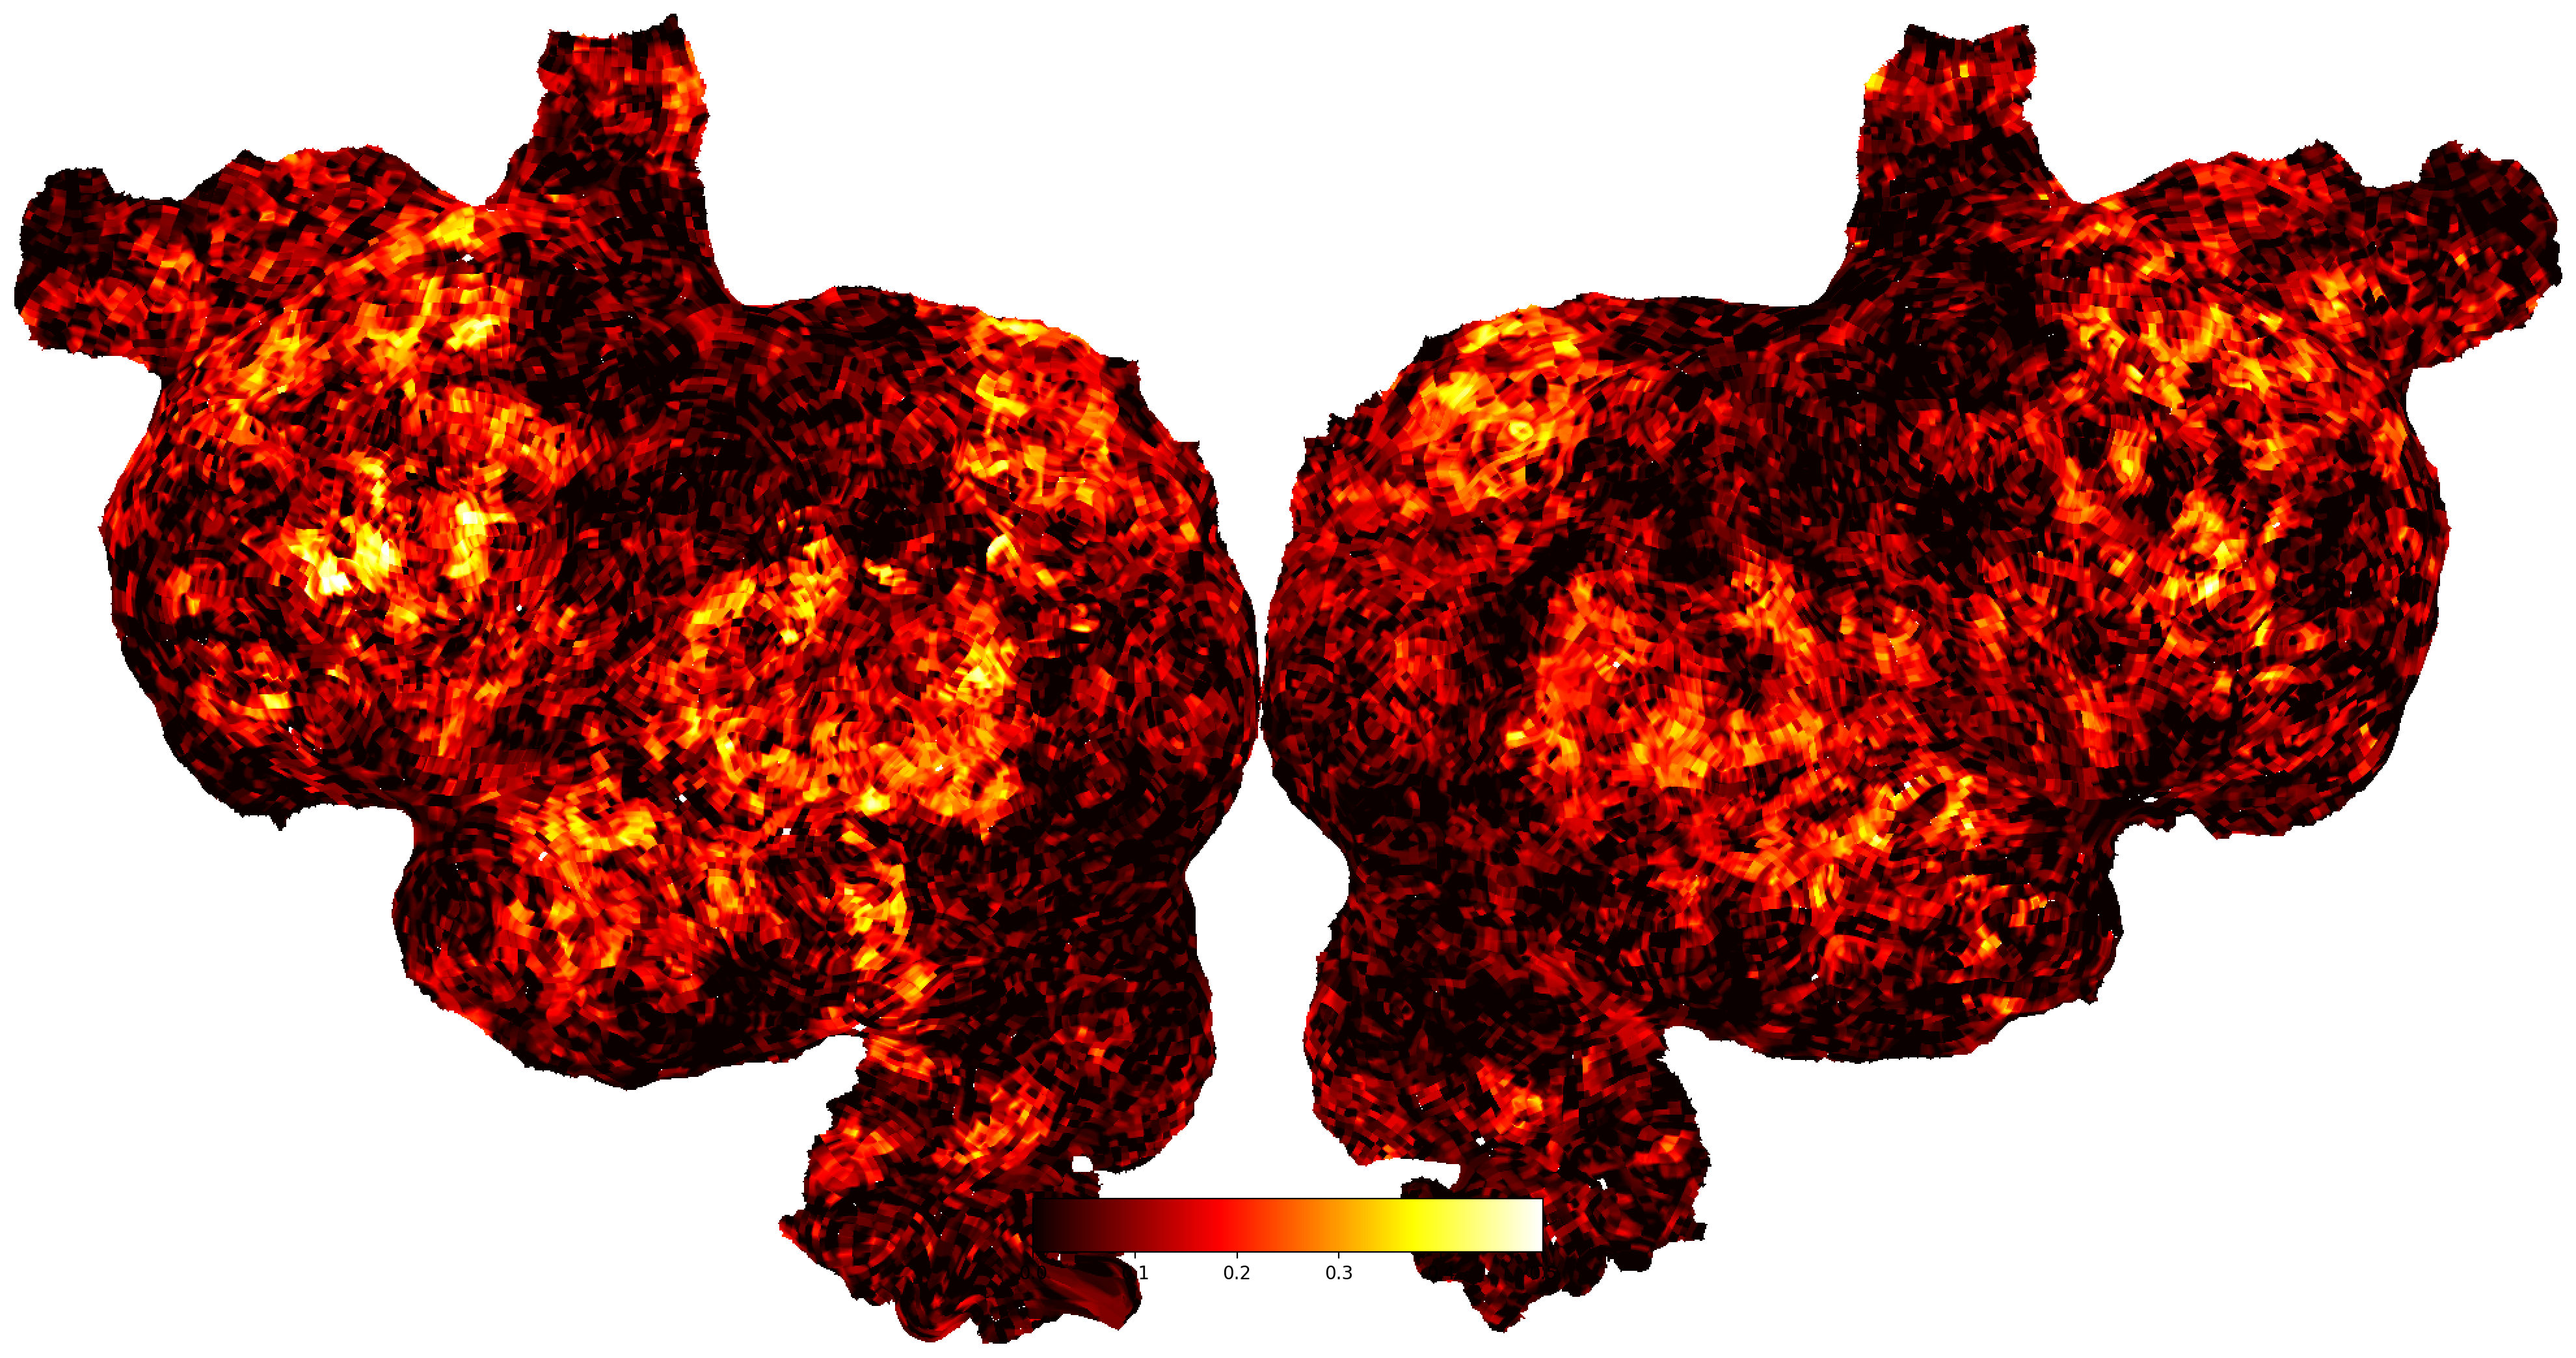
A mosaic is a quick 2‑D tiling of all slices of a 3‑D volume so we can see the whole brain volume at once. When we mosaic a mask, we see which voxels are included. When we mosaic correlation scores, we see where accuracy is high across slices.
9) After training the regression, what did we actually predict
We predicted the fMRI timecourse in each voxel for a held‑out story. We then computed the correlation between predicted and measured signals. That correlation is our accuracy score for that voxel.
10) What does the “mosaic of correlations” show and why are some areas red
It shows the correlation value for each voxel arranged as a tiled set of slices. Red areas have higher positive correlation. Translation: in those areas, our features explain the signal well. Clusters of red often appear in auditory and language‑related regions.
11) What are “semantic maps” and why are they useful
Semantic maps are brain maps that show where different kinds of meanings are represented during natural listening.
Why useful: they provide a data‑driven picture of which regions carry semantic information over time. They also form the basis for decoding approaches that try to recover the gist of language from fMRI in later work.
12) Does speech light up almost the whole brain
No. It engages several networks that are large but specific: auditory cortex for sounds, a language network for structure and meaning, and narrative or memory networks for storyline tracking. It is broad because stories involve many processes at once, but it is not the entire brain.
13) If we cannot predict every word, why is this research a big deal and where is the application
Science: it shows how meaning is distributed across cortex during natural stories, not just in lab toy tasks.
Method: the encoding‑then‑decoding framework is now standard. Once we can predict brain activity from features, we can try the reverse and read out information content from the brain in a validated way.
Communication aids: later work built on this and reconstructed the gist of continuous language from non‑invasive fMRI. That is a step toward future brain‑computer interfaces for patients who cannot speak.
Clinical mapping: language‑related maps help surgical planning by identifying regions likely critical for language in an individual.
AI‑brain alignment: lets us test which computational features from speech or language models best match brain representations.
Glossary
BOLD: the fMRI signal that reflects blood oxygen changes following neural activity over seconds.
Voxel: a 3‑D pixel of brain tissue in the image. One fMRI time series per voxel.
Encoding model: uses stimulus features to predict brain activity.
Decoding model: uses brain activity to infer stimulus information.
TR: Repetition Time. The full form is Repetition Time (sometimes written as Time of Repetition). It is the time between successive whole-brain image acquisitions and is the fMRI sampling period. Example: TR = 1.5 s means you get one brain volume every 1.5 s. When resampling features, smooth first, then keep one value per 1.5 s so features align with fMRI.
Z‑score: standardize a signal to mean 0 and standard deviation 1.
Low‑pass filter: keeps slow changes, removes fast ones.
Anti‑aliasing filter: a low‑pass filter used before downsampling to prevent aliasing.
Lanczos filter (3‑lobe): a practical anti‑aliasing filter for high‑quality resampling.
FIR model: adds time‑shifted copies of features so the model can learn the delay profile for each voxel without assuming a fixed shape.
Semantic map: a brain map that shows where meaning‑related features explain the signal.
References
(Accessible mix of papers and documentation relevant to this tutorial and write‑up)
Huth, A. G., Heer, W. A. de, Griffiths, T. L., Theunissen, F. E., & Gallant, J. L. 2016. Natural speech reveals the semantic maps that tile human cerebral cortex. Nature. https://www.nature.com/articles/nature17637
Tang, J., Varley, T., A. Huth, A. 2023. Semantic reconstruction of continuous language from noninvasive brain recordings. Nature Neuroscience. https://www.nature.com/articles/s41593-023-01286-2
de Heer, W. A., Huth, A. G., Griffiths, T. L., Theunissen, F. E., & Gallant, J. L. 2017. The hierarchical cortical organization of human speech processing. Journal of Neuroscience. https://www.jneurosci.org/content/37/27/6539
Pycortex documentation and gallery. https://gallantlab.org/pycortex/
Encoding and decoding in fMRI tutorial notes (general concept overview). https://gallantlab.org/brain-reading/
Lanczos resampling overview. https://en.wikipedia.org/wiki/Lanczos_resampling
Aliasing and anti‑aliasing explained. https://en.wikipedia.org/wiki/Aliasing
FIR modeling for fMRI (conceptual overview). https://en.wikipedia.org/wiki/Finite_impulse_response
Basic MRI vs fMRI primer. https://en.wikipedia.org/wiki/Functional_magnetic_resonance_imaging